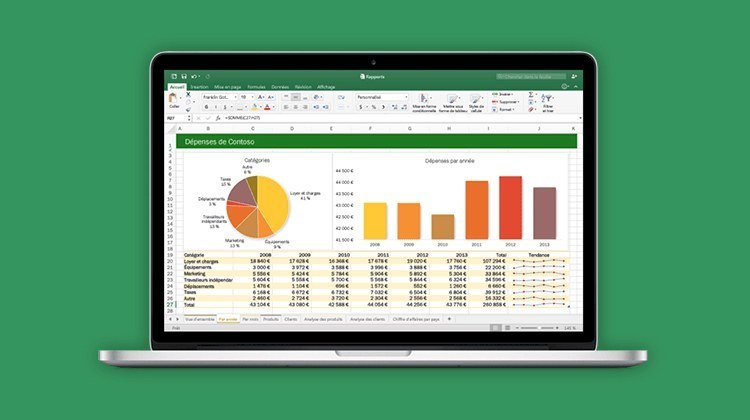
Live Training Microsoft Excel - Quickly highlight top and bottom performer
Live Training Microsoft Excel - Quickly highlight top and bottom performer
- 1h 35 min
- Viewed 2175 times
Training Theme
Learn how Microsoft Excel can help you get the most out of your results quickly. Hover preview will help you discover all the automatic and/or conditional formatting of a table, series, cell.
All our trainings, especially on highlighting top and bottom performers, are carried out by our expert trainers.
Training Objectives
You use Microsoft Excel regularly and want to easily highlight top and bottom performers.
At the end of this training, you will know:
- What saves time on a daily basis
- How to use what's new in Microsoft Excel to improve the readability of tables
Prerequisite and Target Audience
Target audience: Users who are familiar with Microsoft Excel’s features and want to learn how to showcase their data and results
Startup Level: Intermediate
Prerequisite: Know the basic features of Microsoft Excel and be able to use the tool independently
Means and Methods
- Virtual classroom: The training is carried out remotely with a virtual classroom tool. Live interaction with a trainer enabling participants to ask questions.
- Virtual class replay: Recording of a virtual class allowing a complete approach to the application by means of concrete examples of use.
- Documents and other materials: Additional information or educational activities to complement this course.
Training Content
45-min Distance Learning (and/or its video recording)
- Tables in Excel (creation mode)
- Automatic formatting
- New formula references in table area
- Conditional formatting
- Insert and personalize a Sparkline
- Create and customize a graph
1 Course Knowledge Validation Quiz
Learn more about Microsoft Excel
Microsoft Excel is the ideal application to organize your data in structured tables, allowing you to process it more easily and derive results from it. But your spreadsheet software doesn't stop there: you also have several tools to allow you to highlight this data, depending on its characteristics. With autoformatting, you can, for example, choose to display dates or currencies in a certain way and reflect it throughout your document. Not only do you save time, but your Microsoft Excel file also becomes more readable for you and your colleagues.
Moreover, if you hesitate, a simple hover of the mouse on a row, a column or a cell, and the application suggests different types of formatting: you are never short of inspiration!
Finish by using chart tools to visually highlight your data and results. You will then just need to update your data so that your charts, bars and pie charts are updated automatically.
1h 35 min
